GUI For Hyperspectral Image Preprocessing Using Python
1. Introduction
In layman’s language, remote recognizing is the checking of Earth by satel- lite or high-flying workmanship so as to get data concerning it. It’s essentially the investigation of getting data concerning articles or zones from a detachment, sometimes from claim to fame or satellites.
Remote sensors collect learning by examination of the criticalness that is reflected from the planet. These sensors are on the satellites or mounted on the workmanship.
Remote sensors are either inactive or dynamic. Standoffish sensors answer to outer redesigns. They record standard centrality that is reflected or discharged from the Earth’s surface. The essential ordinary supply of radiation perceived by inert sensors is reflected in the sunshine.
In a refinement, dynamic sensors utilize inward upgrades to gather getting the hang of concerning Earth. For instance, an optical contraption shaft remote distinctive structure comes a laser onto the outside of Earth and measures the time that it takes for the laser to reflect back to its perceiving part.
2. Application of Remote Sensing
Coastal applications: Screen bound changes, track dregs transport guide waterfront alternatives. This information is utilized for the seaside mapping and disintegration block.
Ocean applications: Screen sea dissemination and the ebb and flow frame- works, live sea temperature and wave statures and track sea ice. This learning is won’t to higher see the seas and the best approach to best oversee sea assets.
Hazard applications: Tack hurricanes, earthquakes, erosion and flooding. This knowledge is wont to assess the impacts of natural disaster and make readi- ness ways to be used before and once a venturous event.
Natural resource management: Monitor land use, map wetlands, and outline life circumstances. This information is wont to limit the insidiousness that urban improvement has on the setting and bolster pick the most ideal ap- proach to manage the guarantee run of the mill assets.
3. Formats Of This Hyperspectral Image
Multiband image data are represented by a combination of spatial position (pixel number and line number) and band. The data format for remote sensing images is classified into the following three types:
BSQ: Band SeQuential image data (pixel number and line number) of each band are separately stored.
BIL: Band Interleaved by Line data are arranged in the order of band number and repeated with respect to the line number.
BIP: Band Interleaved by Pixel data with respect to each pixel arranged spa- tially by pixel number and line number.
For shading picture yield, BSQ organization would be helpful on the grounds that three groups will be doled out to R, G and B. Anyway BIP arrangement would be better for characterization by most extreme probability classifier in light of the fact that multi-band information are required pixel by pixel for the multi-variable handling. BIL would be a trade off among BSQ and BIP.
Remote detecting data some of the time incorporates various explanation information also to picture information. So the satellite picture information have been given in a standard organization called World Standard Format (as a rule utilizes BSQ or BIL format), or LTWG position (indicated via Landsat Technical Working Group).
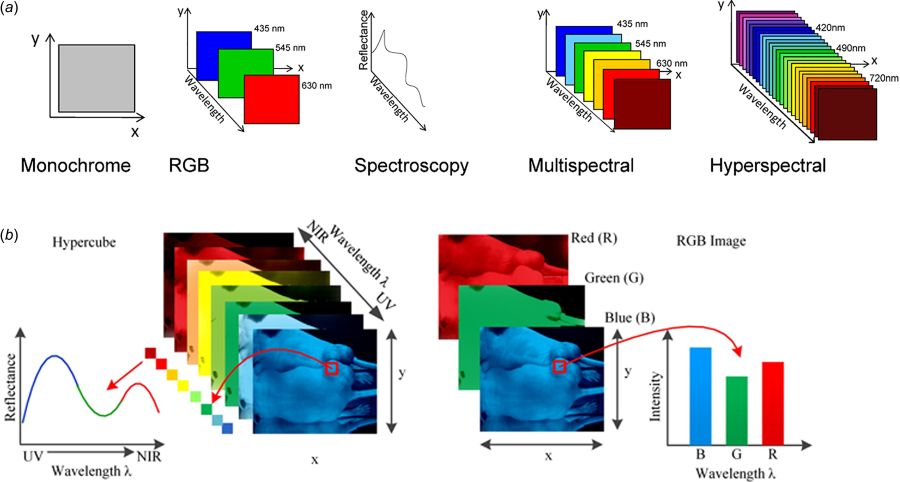
4. Reflectance Value of Hyperspectral Images
Each non-living or living body reflects also ingests transmissions by numer- ous sources. Presently the satellites transmit flag which is pondered by items Earth. Each material assimilates an alternate measure of transmissions and re- flects an alternate measure of transmissions.
The reflected flag figures out which object is there and stores the reflectance esteems. There are 425 groups which store distinctive snippets of data of a pixel and has diverse reflectance esteems for various wavelengths. By plotting of reflectance esteems versus wavelengths chart we can realize which object it is and furthermore the qualities of that object.
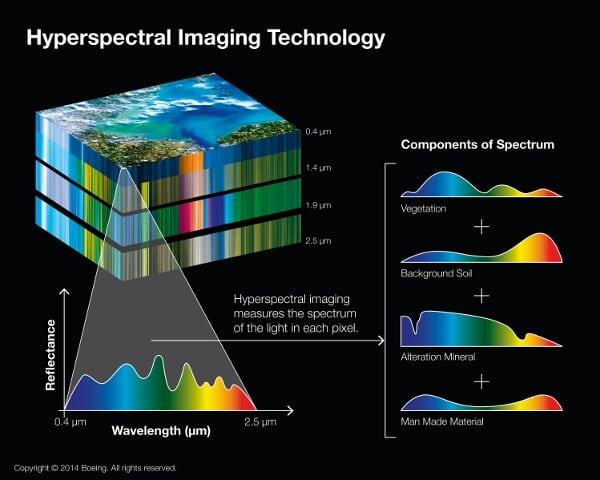
5. Classification of Reflectance Values
The classification of the objects can be done on the basis of wavelengths. Few examples are given below.
Vegetation: Chlorophyll being green acclimatizes light at wavelength around 0.45m (blue) and 0.67m (red) and reflect immovably in green light, in this man- ner our eyes see strong vegetation as green. Strong plants have a high reflectance in close infrared some place in the scope of 0.7m and 1.3m. This is fundamentally a result of the inside structure of plant leaves. As the inside structure of leaves varies from plant to plant. This urges us to understand which plant is there.
Water: In the liquid state, water has commonly low reflectance, with clear wa- ter having the best reflectance in the blue portion of the unmistakable piece of the range. Water has high absorption and no reflectance in the nearby infrared wavelengths extend.Turbid water has high reflectance in evident district than clear water. This is moreover substantial for wa- ters containing vegetation. Ice and snow all things considered have high reflectance over each perceptible wavelength. Reflectance reduces in the nearby infrared section and there is low reflectance in shortwave infrared.
Soil: Exposed soil, for the most part, has to expand reflectance, with more noteworthy reflectance in close infrared and shortwave infrared. A few variables influencing the reflectance are:
-
Moisture Content
-
Soil Texture
-
Surface Roughness
-
Presence of FeO 2 and Fe 2 O 3
-
Moisture Content
6. GUI Usage
The GUI, presented above is made in python using Tkinter library. This library contains functions like Button, Menu, Canvas, Frame, etcetera. I also used classes like filedialog. This class contains functions used to open a dialog box to navigate hrough computer drives and select the file.
Here I first created a frame in which we will be making other features like buttons or menu or even loading the photo. After that I created a navigation menu bar which contains options like File and Edit which contains options like:
-
File: ”Open”, ”Save”, ”Exit”
-
Edit: ”Bands”
-
Quit: ”Quit”
6.1 File
The Open option will open a dialog box which will be used to select the .ENVI file which then will be used to load the hyperspectral image. The Save option will save the current modified image as .ENVI file or any other as per users choice. The Exit option will close the window and the program will shut down.
The Open option opens a dialog box and allows us to select the image to open. For this I used the spectral library of python from which I used io class and envi function.
6.2 Edit
The ”Edit” menu contains ”Bands” option which will open a window in which the user have to enter 3 values i.e the bands which will show the image in having the entered bands.
6.3 Graph
The graph in one the image above is created by Spectral library. This library has an in-built function that will show the graph of reflectance values vs wavelength. This graph gives us the information of the object present in the pixel selected.
6.4 Preprocessing
The bands having negative values are not used and so we need to remove it. For that I used a library called Hyspeclib. This library gives eigenvavlues and minimum and maximum reflectance values so that we can remove the negative values. Usually the negative values are -9999 and so it is easy to know them and remove them.
After their removal, the image is saved in two parts where the original image is stored and then the saved image is opened. This image does not contain reflectance values that are negative.
7. References
-
https://www.rsipvision.com/image-processing-for-precise-agriculture/
-
https://dialnet.unitioja.es/descarga/articulo/5178334.pdf
-
http://gsp.humboldt.edu/OLM/Courses/GSP_216_Online/lesson2-1/reflectance.html
-
http://www.spectralpython.net/
-
https://github.com/hetul-patel/hyspeclib
8. Acknowledgement
I would like to express my deepest appreciation to all those who provided me with the possibility to complete this project. I acknowledge with thanks, the support rendered by Prof. Tarjani Vyas and Junior Research fellow Kinjal Dave, under whose support I was able to complete the task in a given period of time. I also appreciate the constructive suggestions given by my friends to further enhance the content of the project and report. At the home front, I am extremely grateful to my family members for the support and encouragement I got from them in successfully completing the project.
9. Run The Code
Intall the requirements from requirements.txt.
pip3 install -r requirements.txt
To run the program run the Front_End_GUI.py file.
python3 Front_End_GUI.py
10. To-Do
- Identifying the region based on reflectance value.
- Using clustering algorithms to predict the region.
- Format the code to a more readable format.